
What is Parameter:
Parameter is dynamic value that can change in the chart as a filter condition automatically without modifying the filter condition manually.
Note:
The below steps can be implemented on all the version of tableau (Tableau 9.0 and above).
Steps to create the Parameters:
-
- Open a Tableau workbook
- Click on a new sheet.
- Take the dimensions and measures into the sheet.
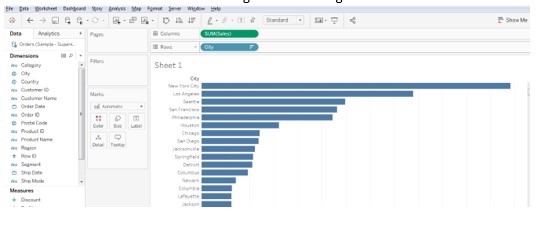
- Like City into the Rows.
Sum of sales into the columns and arrange in descending order as shown in the screenshot.
-
- Now here I want to show the top N city sales in the graph instead of all the city sales.
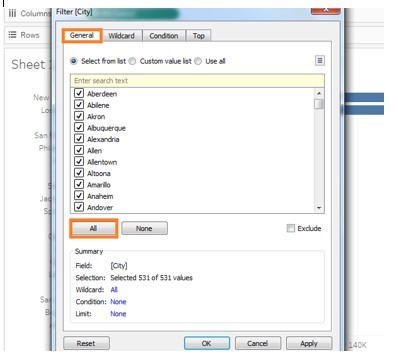
- Drag City into the filters pan, it will show the below window and we need to select all the cities in the list
-
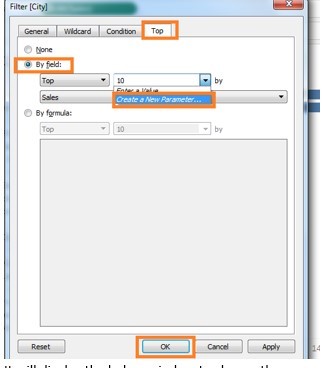
- Next as we need to see only the Top n countries as per requirement, click on Top, Click on By field and at Top we need select the create a parameter at drop down box as shown in the below screenshot.
-
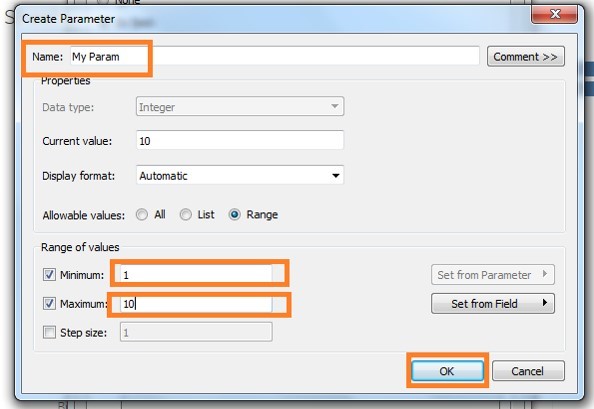
- It will display the below window to choose the parameter properties, we need to select the Minimum number and Maximum number and click on Ok button.
-
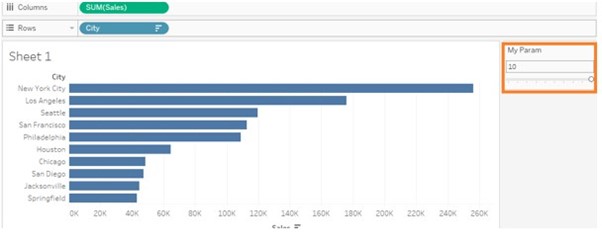
- Parameter will be created under parameters and it can show only the top 10 sales cities in the graph as shown in the below screenshot and we can slide the parameter value to get the selected value so that we can see the selected top N countries of maximum 10 countries.
Parameters advantages:
-
- Filters are static and we need to change always the filters manually where as with parameters we can slide the number and it will reflect the top N sales on the sheet without changing filters manually.


