Empowering Smarter Decisions with Dashboard & Data Visualization Services
- Transform complex data into clear, actionable insights with S-Square’s Systems’ advanced dashboard and data visualization solutions. Our custom-designed dashboards provide real-time analytics, enabling you to make informed decisions swiftly and confidently.
- Our intuitive interfaces and dynamic visualizations are tailored to meet your unique business needs.

Dashboard & Visualization Solutions to Drive Insightful Decision-Making
At S-Square, we help businesses bring their data to life. Our dashboard visualization service is designed to turn complex datasets into clear, actionable insights so you can confidently make smarter, faster decisions.

Dashboard Development
We build interactive, user-centric dashboards tailored to your business needs. Whether you’re tracking KPIs or exploring trends, our dashboards are built to deliver real-time visibility and meaningful context.

Dashboard Optimization
Using dashboards but not getting the full value? We enhance existing dashboards to improve performance, usability, and clarity, ensuring your team always sees what matters most.

Power BI Services
Power BI dashboard automation allows us to create intuitive, data-rich reports that support informed decision-making across the organization.
Scale Up Your Business with Dashboard & Data Visualization Services

Data Consulting Services
We offer strategic guidance on everything from data modeling to enterprise analytics frameworks. Our consultants work closely with your team to align data management and visualization initiatives with business goals.

Data Visualization Optimization
We refine your visualization layers to ensure your data looks good and tells the right story. This means selecting the right charts, layouts, and design principles for clarity and impact.

Data Analytics & BI Platform Development
From architecture to deployment, we build scalable analytics platforms that integrate seamlessly with your existing systems, empowering teams with accurate insights when they need them.

Data Visualization Strategy & Implementation
We go beyond dashboard design by helping you develop a visualization strategy—planning, building, and rolling out data management and visualization for better decisions at every level.
Our Knowledge in Dashboard & Data Visualization Technologies
At S-Square, we integrate advanced data management and visualization technologies to transform data into actionable insights. Our knowledge spans a range of platforms and tools, ensuring efficient data collection, automated reporting, and real-time dashboard updates.
Data Visualization Platforms
We use leading tools such as Power BI, Tableau, JMP, Microsoft Excel, Datawrapper, Plotly, and Qlik. As a custom data visualization service provider, we can create interactive and insightful dashboards tailored to your business needs.
Visualization Libraries
Our solutions incorporate robust libraries like JS Charting, Fusion Charts, Chart.js, D3.js, and Highcharts to deliver dynamic and responsive visualizations.
Cloud-Based Solutions
To ensure scalability and accessibility, we utilize cloud platforms including Google Data Studio, Amazon QuickSight, and Azure Monitor for seamless data integration and monitoring.
Artificial Intelligence & Machine Learning
Our AI/ML capabilities are powered by platforms such as Azure Machine Learning, AWS SageMaker, Google Vertex AI, Databricks MLflow, DataRobot, and UiPath AI Center. They enable predictive analytics and intelligent automation.
Robotic Process Automation (RPA)
We implement RPA solutions using tools like akaBot, UiPath, Automation Anywhere, Microsoft Power Automate, and Blue Prism to automate repetitive tasks and enhance operational efficiency.
Intelligent Automation & No-Code Platforms
Our intelligent automation layer integrates platforms like akaBot, UiPath, Power Automate, and Blue Prism. We offer no-code solutions through redSling and WEM, allowing quick application development without extensive coding.
Our Proven Approach to Dashboard & Data Visualization Services
As data visualization service providers, we follow a structured and collaborative methodology to deliver solutions that align with your business objectives and drive actionable insights.
Discovery & Requirements Gathering
We initiate each project with an in-depth consultation to understand your business goals, data sources, key performance indicators (KPIs), and end-user requirements. This foundational phase ensures that our solutions are tailored to meet your specific needs.
Data Integration & Preparation
Our team connects disparate data sources, performs data cleaning and normalization, and structures the data for accurate and efficient visualization. We prioritize data quality and integrity to ensure reliable insights.
Dashboard Design & Prototyping
Utilizing best-in-class design principles, we create wireframes and prototypes that emphasize clarity, usability, and real-time interaction. Our focus is on presenting metrics that facilitate informed decision-making.
Visualization Development
Leveraging tools like Power BI and other industry-leading platforms, our professionals build interactive dashboards featuring dynamic visuals, such as charts, graphs, KPIs, and maps that adapt seamlessly to your data landscape.
Testing & Optimization
We conduct rigorous testing to ensure performance, accuracy, and responsiveness. Additionally, we optimize dashboards for load time, readability, and scalability across various devices.
Deployment & Training
Upon approval, we deploy the dashboards within your environment and provide comprehensive end-user training to ensure effective adoption and utilization.
Why Choose S-Square for Dashboard and Data Visualization?
At S-Square, we combine deep technical knowledge with a business-first approach to deliver solutions that are insightful, scalable, and built around your goals.


S-Square's Industry Knowledge in Dashboard and Data Visualization
Our deep domain knowledge ensures that each data visualization consultancy solution is customized to meet our clients' unique challenges and objectives.
Manufacturing & Distribution
Using dynamic, actionable dashboards designed for the manufacturing industry, improve production planning, track supply chain metrics, and monitor operational performance.
Real-World Success Stories Reflecting S-Square’s Capabilities
The following case studies highlight how Power BI dashboards have been instrumental in improving patient care and operational efficiency, with S-Square equipped to meet these challenges:
Get in Touch with S-Square
Ready to bring your ideas to life? Let’s collaborate to build efficient solutions that empower your business.
Years of Experience
Customized Software
AI Integration in Existing Software
Software Upgradation
Schedule a free Consultation for Full Cycle
Software Development
Diverse Data Visualization Techniques
We employ a range of data visualization consulting techniques to transform complex datasets into intuitive, actionable insights. Our knowledge encompasses various visualization types, each tailored to address specific analytical needs:


Blog Section
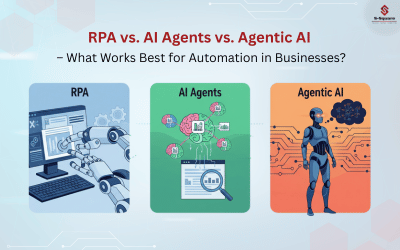
RPA vs. AI Agents vs. Agentic AI – What Works Best for Automation in Businesses?

The Future of Workday AI

Agentic AI: The Future of Enterprise Application Solutions
FAQ
1. What are the benefits of data visualization?
Data visualization simplifies complex datasets, making it easier to identify patterns, trends, and outliers. This clarity enhances decision-making, improves communication, and enables stakeholders to grasp insights quickly.
2. How can data dashboards help my business?
Dashboards provide real-time insights into key performance indicators (KPIs), allowing businesses to monitor operations, track progress, and make informed decisions promptly. They consolidate data from various sources into a single, interactive interface.
3. What is your data visualization process?
Our process involves understanding your business objectives, integrating data from multiple sources, designing intuitive dashboards, and implementing them with tools like Power BI and Tableau. We ensure the dashboards are tailored to your needs and provide training for effective use.
4. What are the different types of data visualization?
We utilize various visualization types, including temporal (time-based), hierarchical (tree structures), multi-dimensional (scatter plots, heatmaps), and geospatial (maps) visualizations, each serving specific analytical purposes.
5. Why is data visualization important?
It transforms raw data into visual formats, facilitating quicker comprehension, revealing hidden insights, and supporting data-driven strategies. Effective visualization is crucial for communicating findings and driving business growth.
6. Which data visualization tools are popular?
We employ industry-leading tools such as Power BI, Tableau, Qlik, and Datawrapper, chosen for their robustness, scalability, and ability to create interactive and insightful visualizations.
S-Square’s Digital Transformation Services
Beyond dashboards and data visualization, S-Square offers a comprehensive range of services to help businesses innovate, streamline operations, and stay competitive in a fast-evolving digital landscape.

Enterprise Applications Services
We help organizations modernize and manage their enterprise applications across the full lifecycle—from planning and development to deployment and ongoing optimization. Whether it’s SAP, Oracle, or Microsoft platforms, we ensure your systems evolve in step with your business goals.

Application Development Services
Our team builds scalable, high-performance applications tailored to your specific needs. We follow a collaborative approach—starting with business requirements and ending with reliable, future-ready software that enhances operational efficiency.

Full Lifecycle Development Services
We offer full lifecycle development, from initial concept to post-launch support. We focus on rapid delivery, agile iterations, and continuous alignment with your strategic objectives to ensure your product delivers long-term value.

Intelligent Automation Services
We combine RPA, AI, and machine learning to automate routine tasks, improve accuracy, and drive productivity. Our intelligent automation services help you reduce manual effort, streamline workflows, and unlock the full potential of your business processes.